Case Studies
This would be a description of what the "case studies" page is and the purpose it will fulfill. The intro paragraph is just a generalization. Maybe even have instructions on how to ask your own questions!
Case Study - New York
Department of Energy analysis from the first three years of New York’s benchmarking policy source
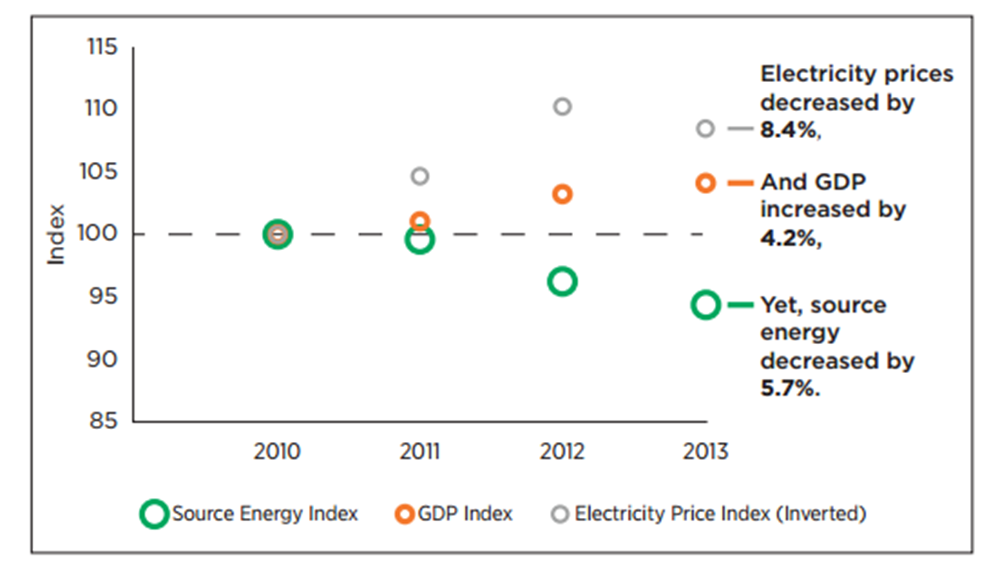
New York’s Energy Savings 2010-2013
- Cumulative energy savings of 5.7%; total dollar savings of $267,492,147
- Source energy savings are higher for older buildings and lower for new buildings
- Benchmarking efforts directly created 39 jobs + ~7,000 jobs through energy efficiency activities
San Francisco
ULI Greenprint analysis of San Francisco’s benchmarking and disclosure policy ordinance source
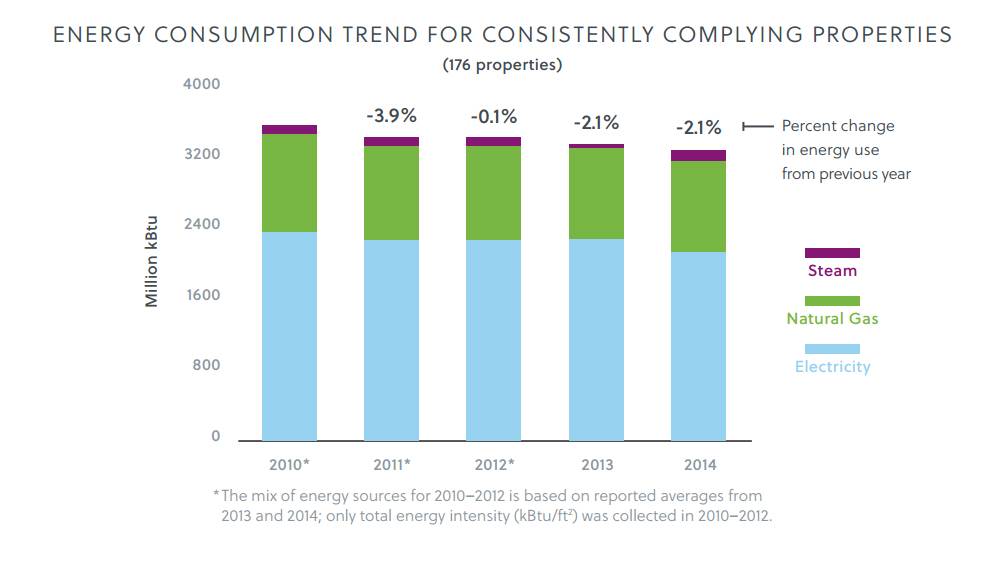
Energy Savings 2010-2014
- Cumulative energy use decrease of 7.9%
- Office market 28% decrease in energy use per full-time employee
References and Additional Resources
Case Study - Washington, DC
Washington, D.C. was one of the first cities to disclose building data. Their disclosure method is to upload a spreadsheet onto the City’s web site that includes a significant amount of building data, including address, owner, size, energy use, building use, etc. This way of displaying the data is true transparency, however, there is a significant concern with presenting data in this manner. The primary concern is the lack of context provided and the difficulty of doing true comparisons across buildings. Fortunately, Cities are trending away from this type of disclosure and are moving to transparency models that provide significantly more context.

Case Study - Philadelphia, PA
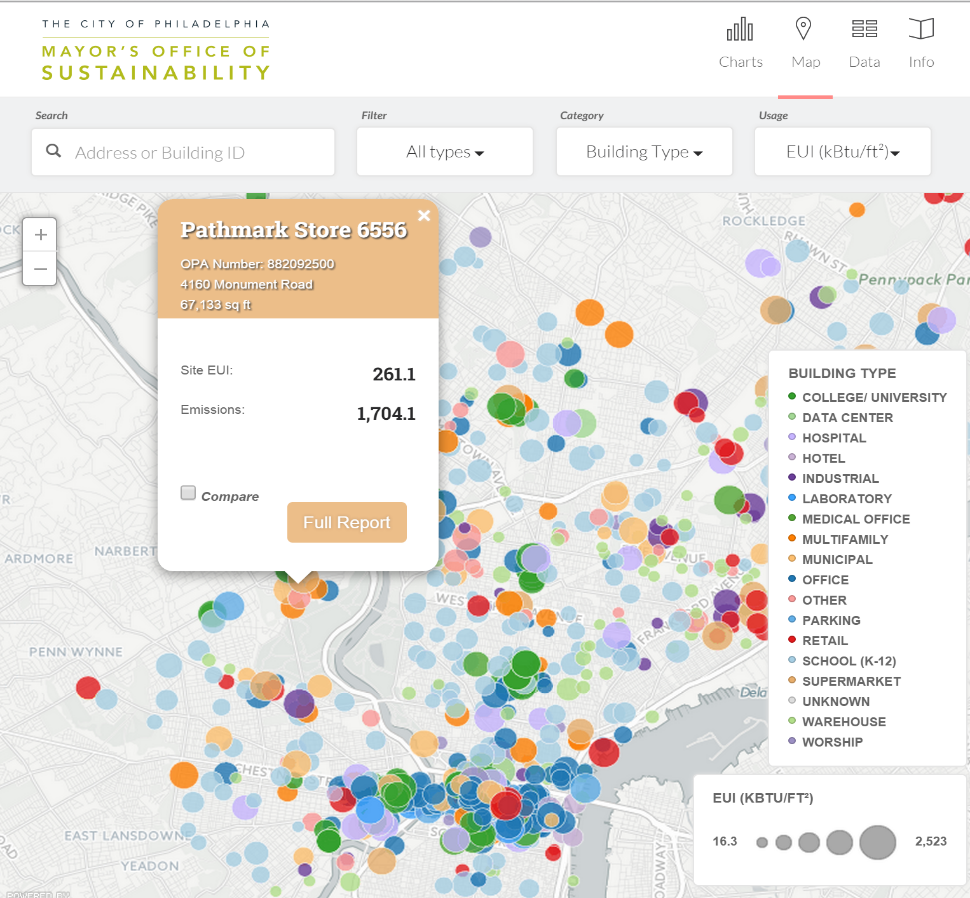
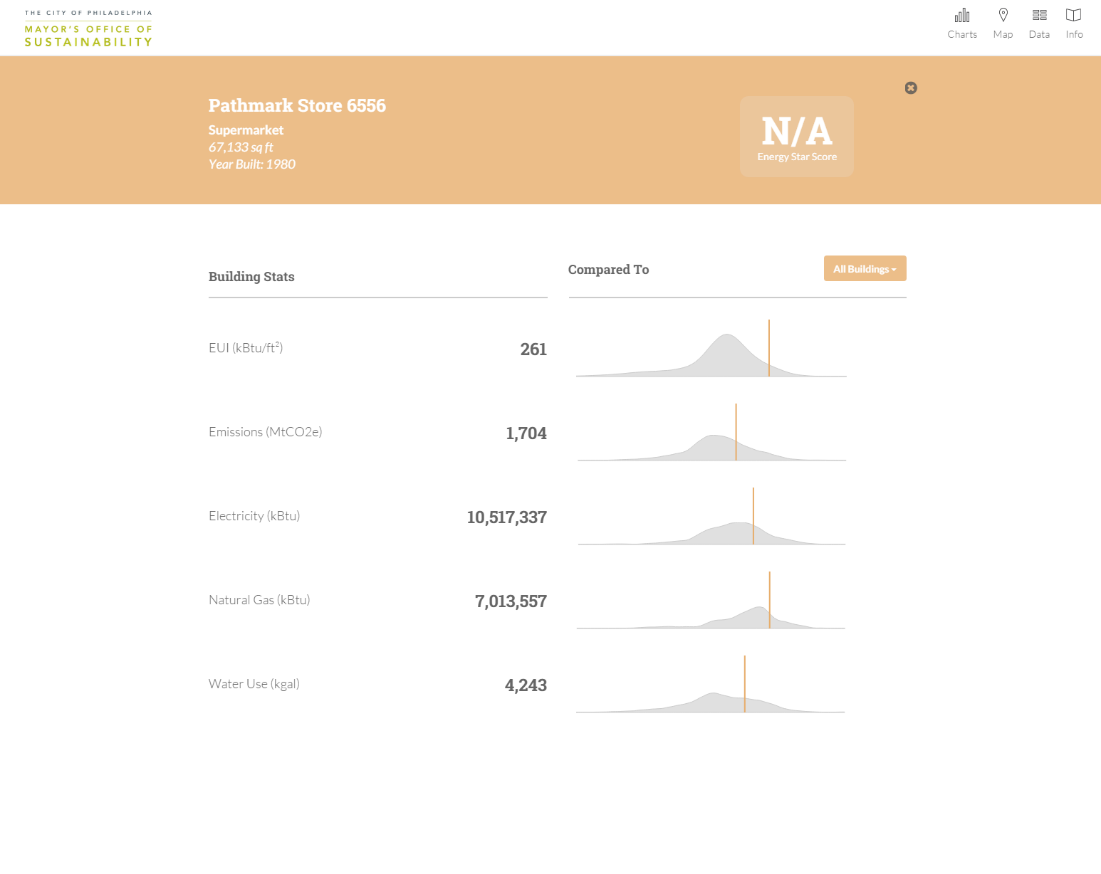
This is a web based example that allows for a significantly greater amount of context. The size of the bubble represents the EUI and the color represents the type of building. By hovering over each bubble more information pops up on the building. The first image demonstrates the map component of the disclosure and the pop-up that occurs when mousing over a bubble. The second picture indicates how this building compares to the population of similar buildings that are reporting their findings. This approach appears to be more favorable to the building operator/owner community because it provides greater context into the building stock and provides greater opportunity to ensure there are fair comparisons. However, there has been some concern that specific building address information is provided, i.e. address.
Case Study - City of Chicago
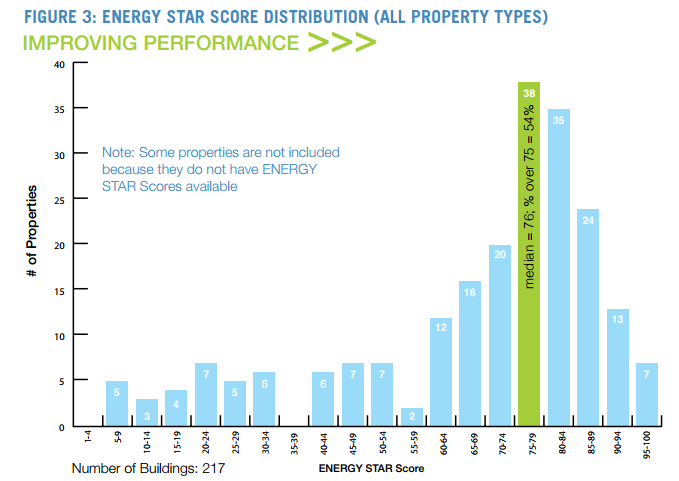
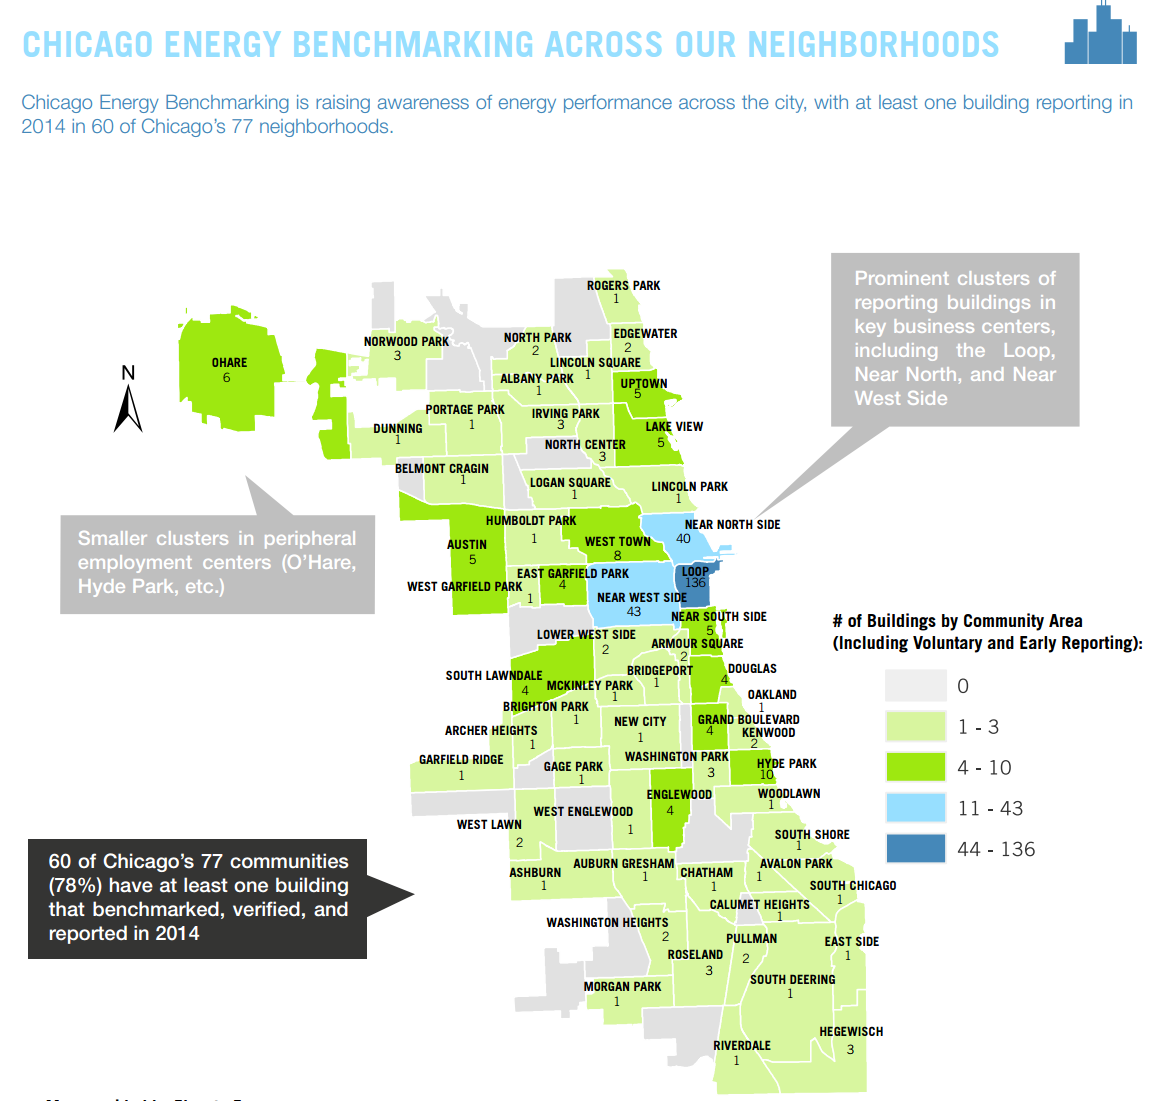
Chicago’s approach is to provide a yearly report of building data that is aggregated in a variety of ways, i.e. building type, square footage, etc., and does not expressly indicate any specific building. This report is a PDF and does not have the interaction, dynamic component of the Philadelphia example. However, there appears to be more comfort by the building sector because it does not allow for building shaming and it does not directly provide building addresses. Beyond this yearly report, Chicago also does a yearly building report card that is sent directly to each building owner/operator. This allows the owner/operator to have a better idea as to where their buildings stand in comparison with other buildings, but, once again, does not allow for public shaming of any of the buildings that may be seen as poor performers.
